
From a CSV to an approved report: the Virospuk workflow
-
 By System Admin
- Engineering guides
- Oct 31, 2026
- 1 minute read
- 13 Views
A walk through data analysis, comparison with a baseline and a controlled report.
A typical Virospuk session starts with a file and ends with a document someone can sign off. Here is the path.
1. Load and check the data
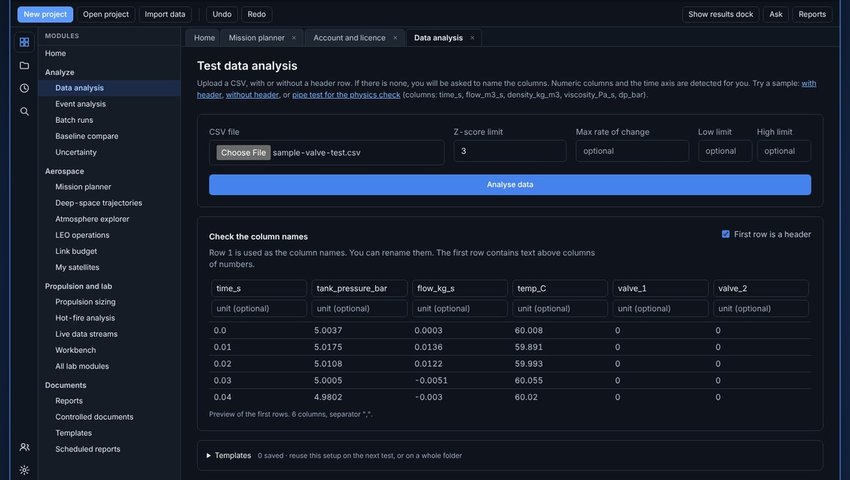
Choose a CSV with or without a header row and name the columns and units. Set a z-score limit, a maximum rate of change and low or high limits, then run the analysis to flag outliers and limit breaches.
2. Compare with a baseline
Save a good run as a baseline. Every later run can be compared with it so you can see what changed, not just what the numbers are.
3. Check against physics
The Physics Check runs a registered calculator on your inputs and compares the prediction with the measured column. Disagreement is reported as a residual and flagged where it exceeds a tolerance.
4. Build and approve the report
Reports are built as Word files. A controlled document has a number, revisions and a named reviewer; when it is approved the file is locked and a SHA-256 fingerprint is recorded so the approved copy can be verified later.
System Admin
Leave a comment
Your email address will not be published. Required fields are marked *